GLASS / PLATE LAB
Specimen 10 / 14 · collaborator edition

OP966

A graded spectral grid, with its line structure recovered.

Calibration specimen

Repeated spectral records yield numerical profiles, and five central-row tracks now support a provisional Balmer-reference wavelength scale with unused-line checks.

Original scan
6,177 × 5,026 px
Source data
16-bit TIFF
Angular scale
Not established
Sky footprint
Not established
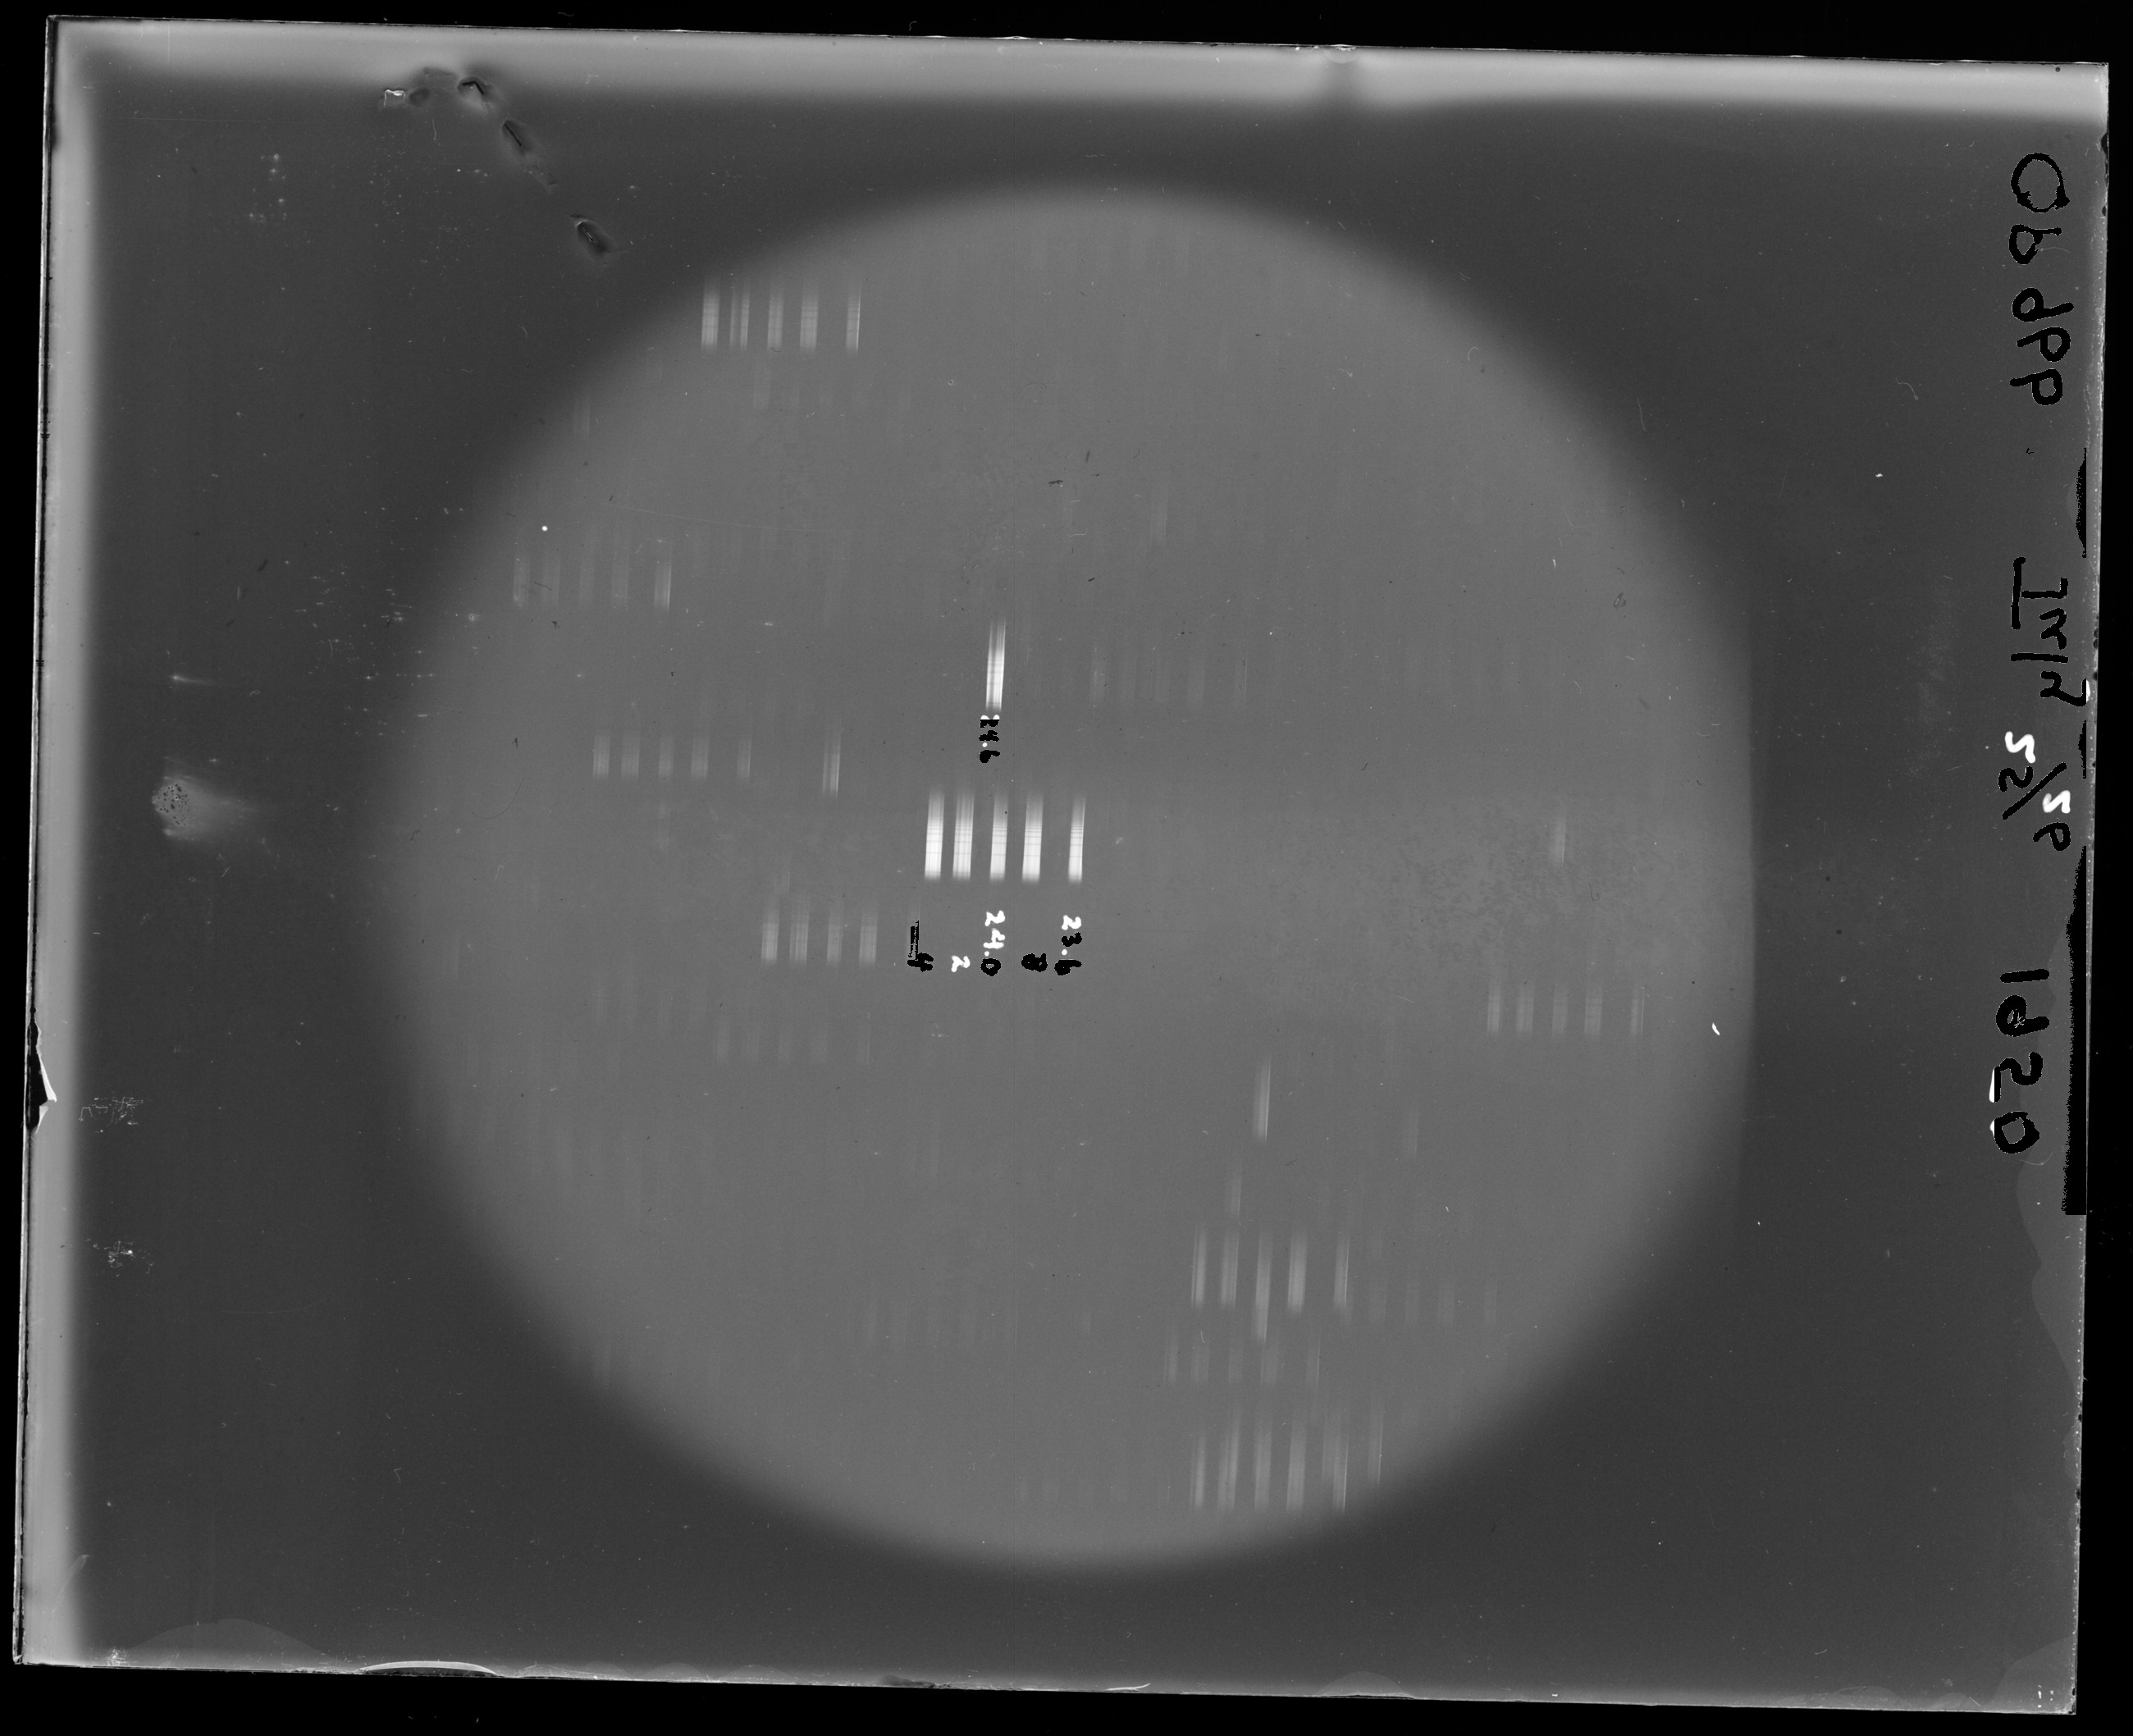
01Complete scan, with its stored orientation retained. Display derivative: recorded 1st–99.7th percentile linear stretch, 8-bit JPEG, reduced for sharing. Click any inspection image to enlarge; click again inside the viewer for its native display pixels.
01 /

What is photographic, and what is written?

Repeated spectra, with five provisional Balmer-reference scales.

Five selected central-row profiles support the consecutive Hγ, Hδ, Hε, H8 and H9 interpretation. Other extracted tracks remain in scan-pixel coordinates. The apparent July 1950 date and written numeric settings do not establish a calibrated exposure or brightness sequence; those settings could be focus positions.

Resolved spectral structure

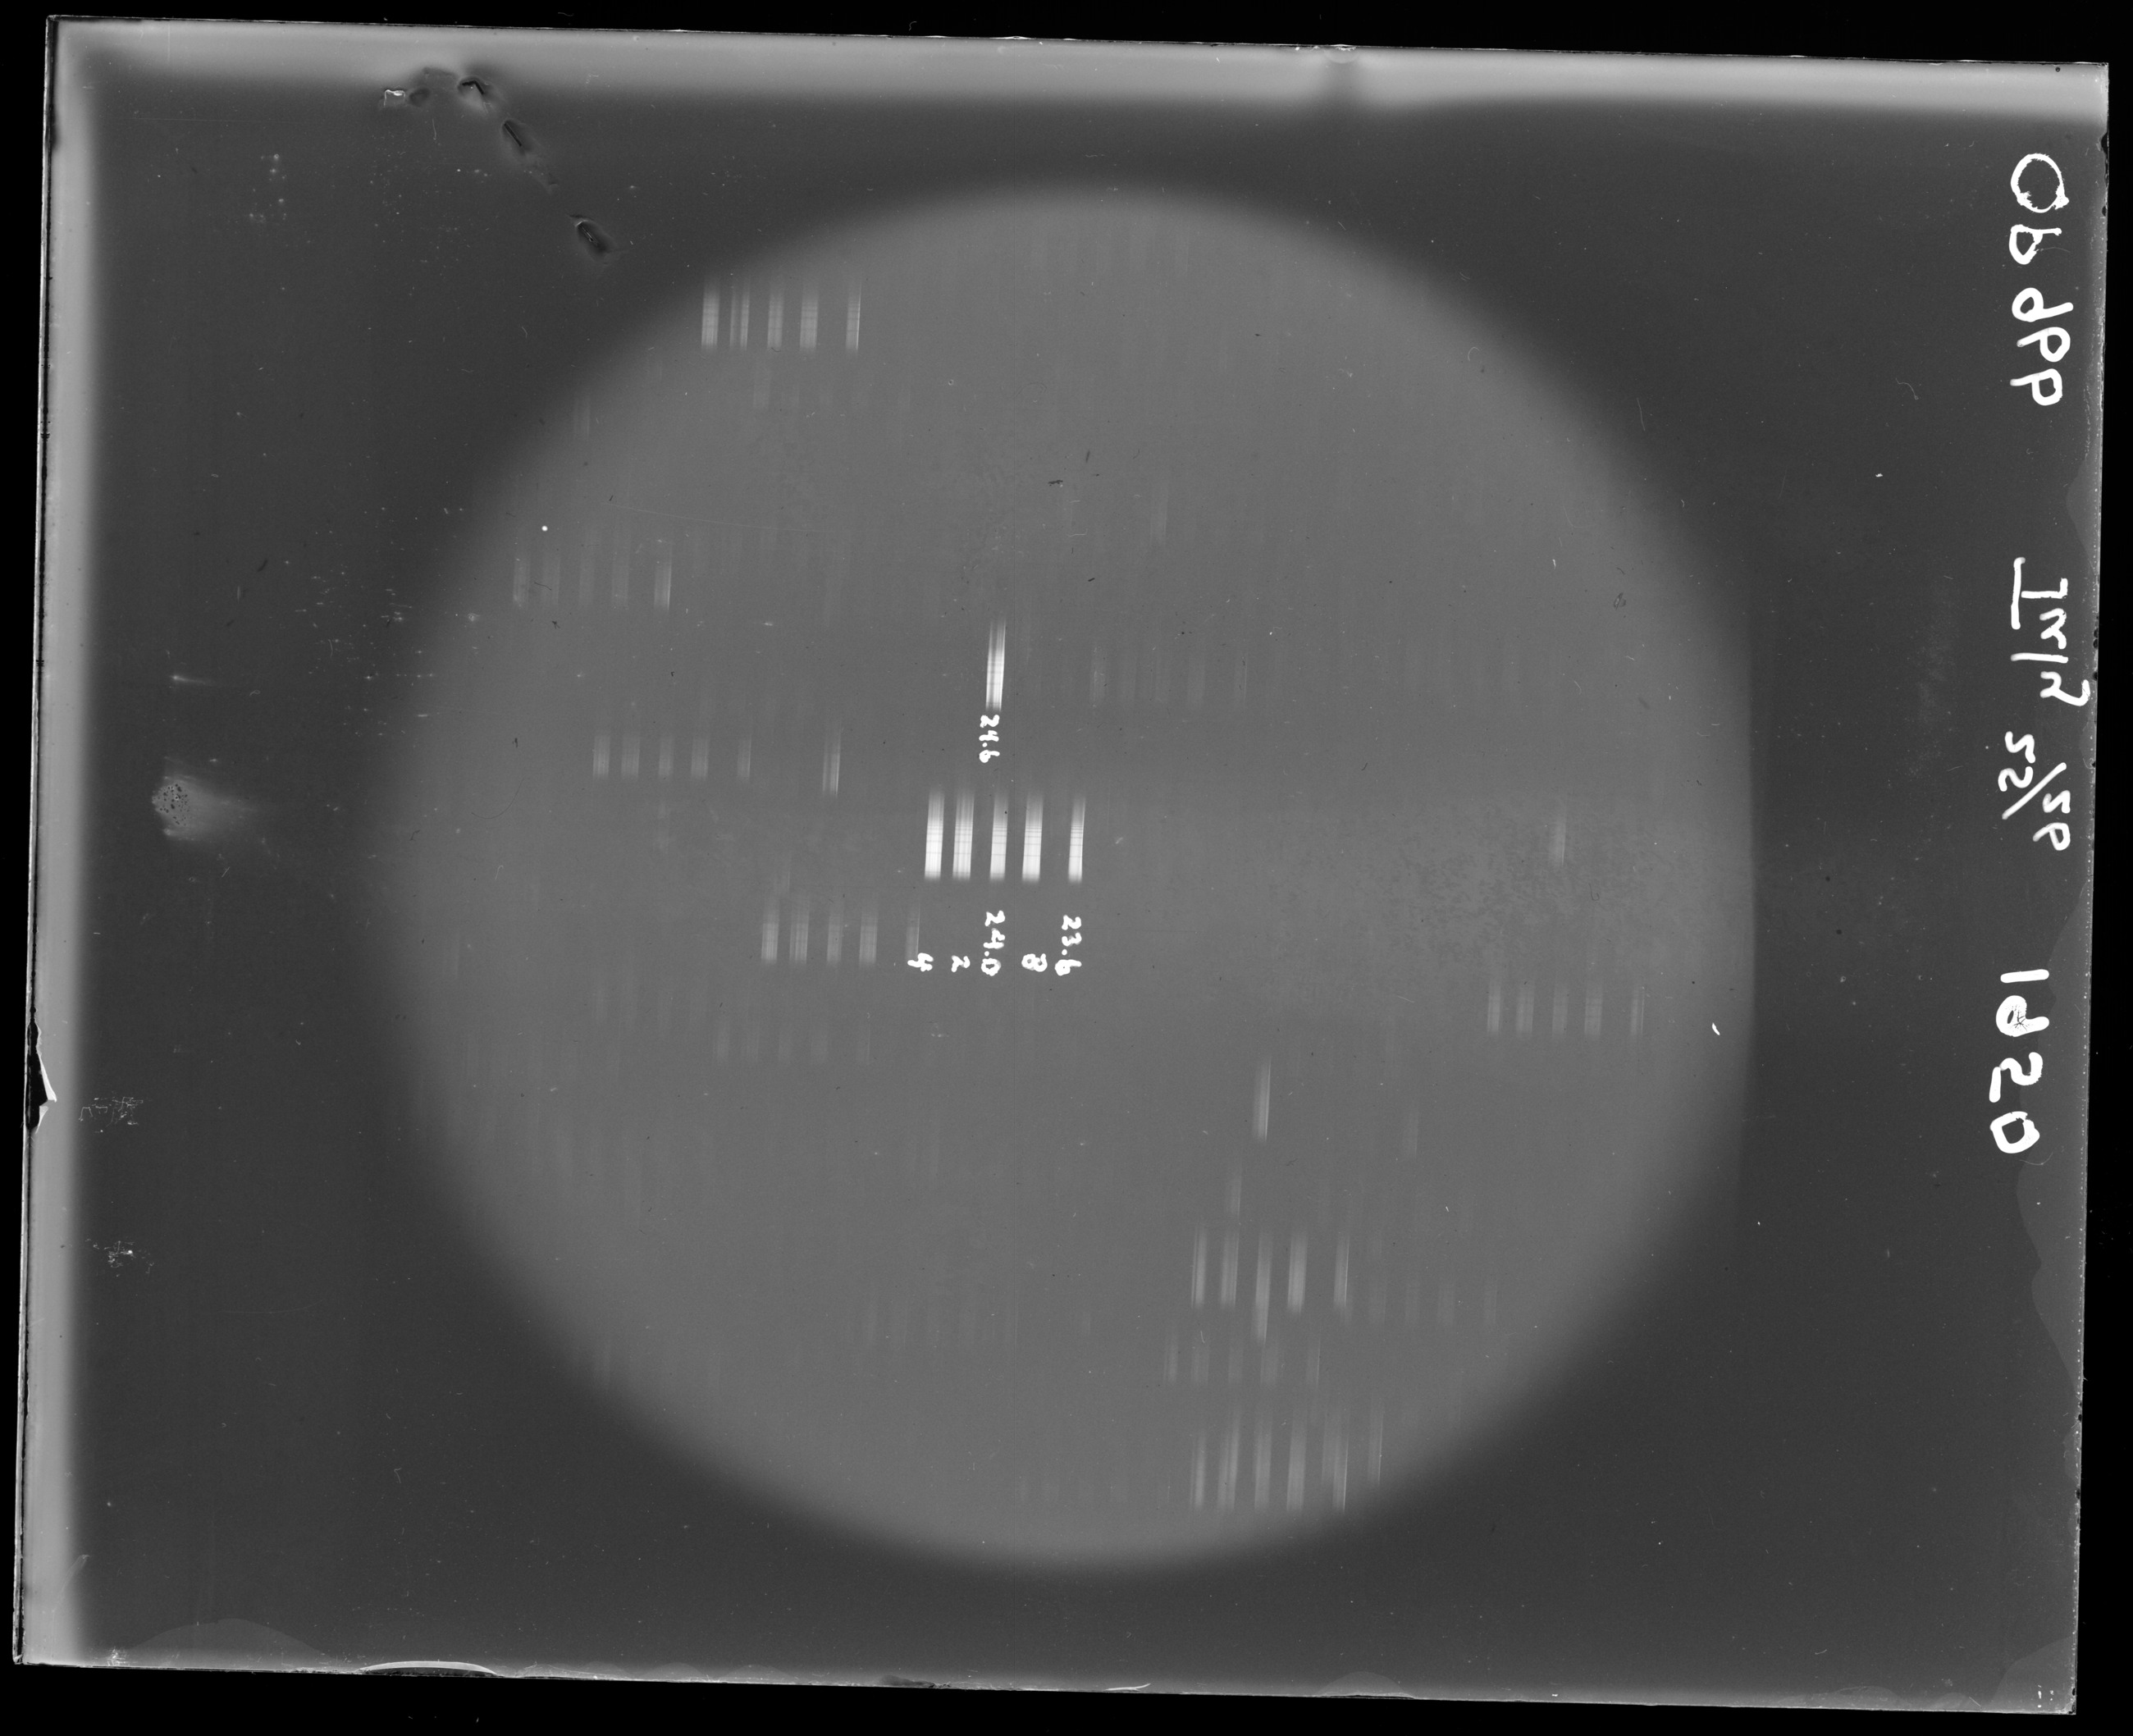
The records show repeated transverse features. Five central-row tracks have provisional Balmer-reference coordinates below; all other extracted tracks retain scan-pixel coordinates.

A dated margin and a revised mask

The margin appears to read “OP 966” and “July 25/26 1950”. A morphology-only pass selected some photographic bars as ink. Inspected exclusion regions now preserve those bars while retaining candidate caption numbers and margin writing.

The central grid displays the photographic streaks that are protected from extraction.
The right margin, rotated and mirrored for reading, provides context for a future exposure-schedule transcription.
02 /

Separate the observed layers.

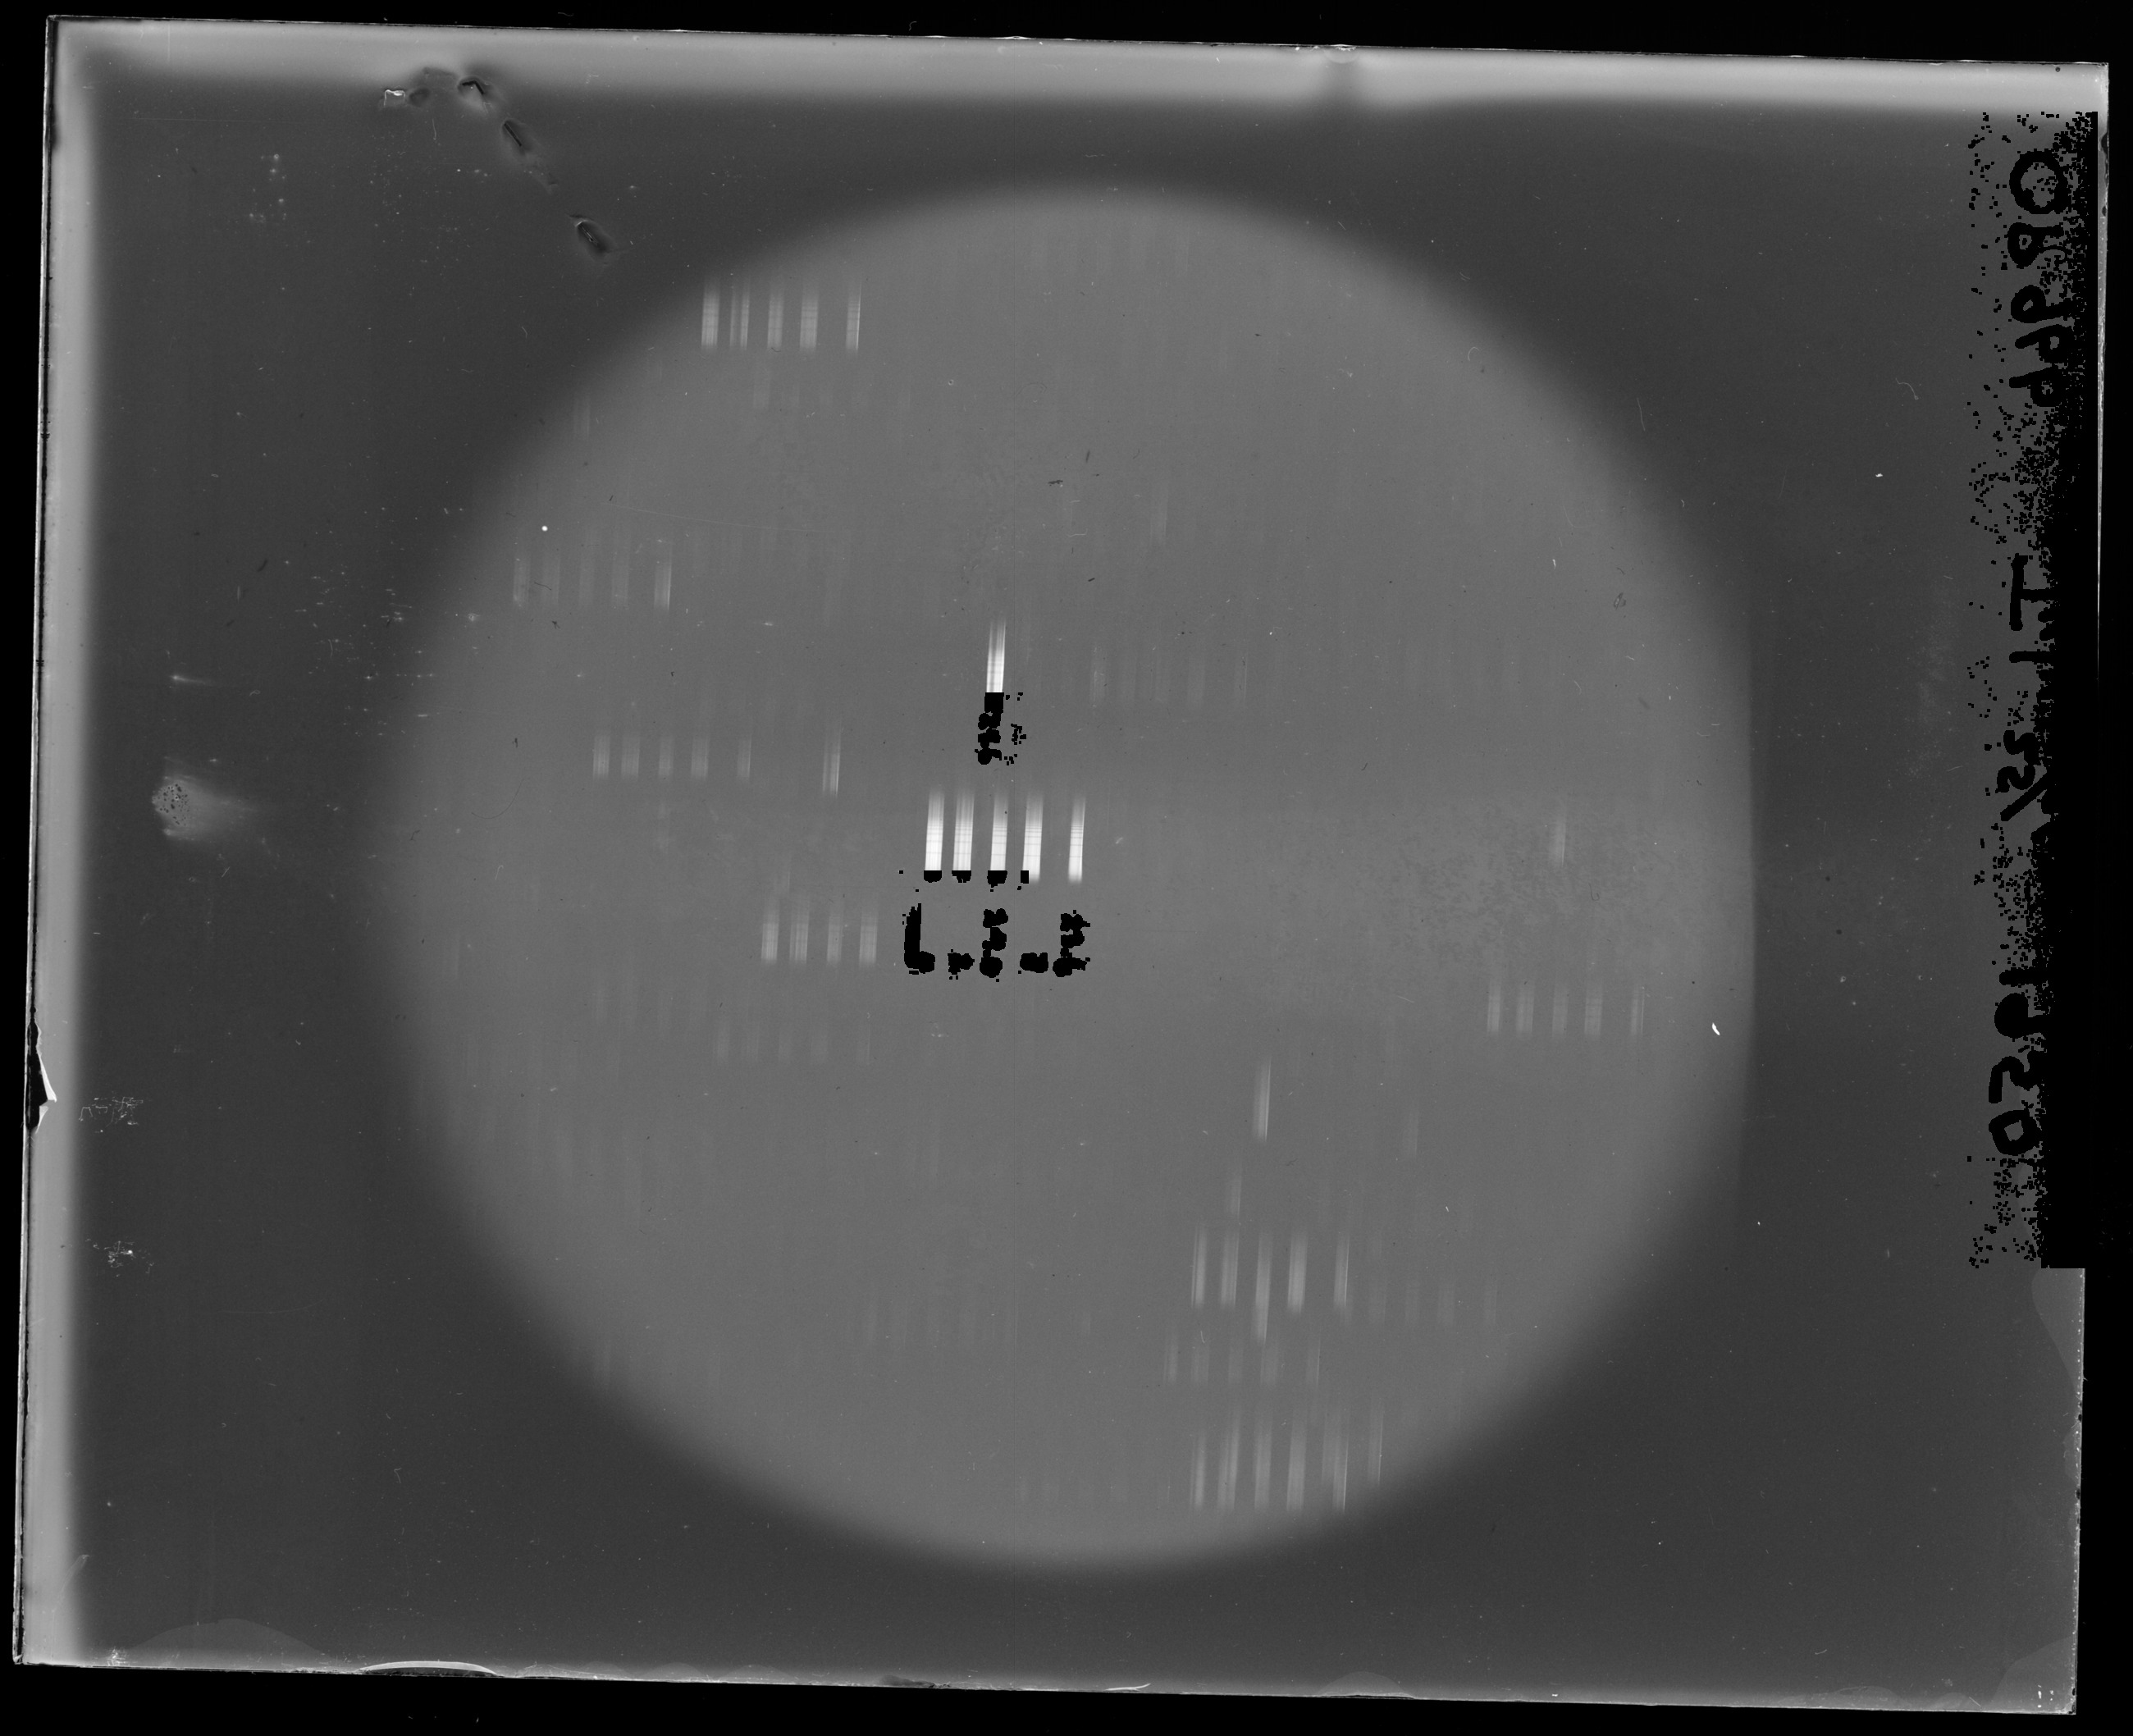
The revised layer uses local contrast in both polarities, expanded inspected writing regions and contextual recovery of short fragments and round digits. Known photographic targets and sampled spectral apertures are protected. It is not OCR and does not reconstruct hidden sky or invent pen strokes.

The selection covers 1.41% of this scan (437,901 pixels). Faint marks, scratches and contacts between ink and photographic images remain ambiguous. The cyan overlay shows the wider exclusion footprint used by the photographic remainder; the stroke mask is supplied separately.

Original scan with candidate annotation selection in cyan
Cyan shows the expanded exclusion area, including edge padding. Move the slider to inspect boundaries and incidental selections.

The writing PNG is a white, contrast-rendered stencil of bright and dark observed marks. The observed-pixel PNG preserves their stretched scan appearance. Both use original scan coordinates. The photographic remainder displays excluded pixels as black holes. It is neither a clean-sky reconstruction nor a new photometric product. Keep the mask alongside any measurements. Native original-intensity TIFF/FITS products, where generated, remain in the analysis workspace and are not duplicated in this handoff.

Annotation revision 2

This revision recovers short letter fragments, round digits and inspected dark marks, with broader writing regions. The stroke selection grows from 175,037 to 437,901 pixels (2.50×). The photographic remainder uses a separate 3-pixel exclusion margin, covering 2.32% of the scan.

The wider selection deliberately favors removing writing. Nearby stars, scratches and ambiguous fragments can also be excluded. Explicit photographic protection regions retain known target images and sampled spectra; this does not establish perfect separation elsewhere.

Previous photographic remainder at left; revised remainder at right. Black pixels are excluded, not restored sky. Both panels show the same scan. The native stroke and exclusion masks are supplied separately.
Previous mask ←→ Revised exclusion
Photographic remainder using expanded exclusion maskPrevious photographic remainder revealed at left
03 /

What the search can establish.

This is not treated as a directly solvable star field. The streak grid has no confirmed celestial catalog correspondence and no WCS is supplied.

No justified sky position is available for this specimen. A catalog image would imply a location the evidence has not established, so none is presented.
03a /

Recover the embedded spectral profiles.

The photographic streaks contain transverse band structure. These are recoverable spectral records rather than featureless bars: the extraction measures selected tracks across the graded grid, including both bright and faint examples. Their exposure interpretation remains open; a selected subset has provisional Balmer-reference scales below.

38 selected tracks are plotted below. Final measurements use original 16-bit TIFF values, one sample per native Y pixel, with linear interpolation across each traced aperture. The average of two adjacent sidebands estimates local background. Final profiles are not smoothed.

The ordinate is scanner response after background subtraction. It is not calibrated flux or optical density, and the abscissa is original scan Y, not wavelength. Normalized comparisons cannot establish sensitivity, line strength or exposure linearity without the scanner/emulsion response and wavelength references.

Cyan aperture boundaries locate the sampled tracks on the original scan. IDs connect the image to individual plots and CSV files. Sidebands lie outside each aperture; nearby blemishes and low-contrast traces still require inspection.
Download this profile CSV ↓
row 1 · 246 native samples · aperture ±11 px
Top: straightened image strip; cyan lines bound the extraction aperture. Middle: background-subtracted response. Bottom: aperture mean and adjacent background. Nearby blemishes and poorly exposed intervals still require inspection.
Selected profiles shown together, each independently divided by its own 95th percentile absolute response. Native pixel positions are retained. This is a pattern comparison, not a common wavelength axis or a calibrated intensity comparison.

What would make these physical spectra?

Identify known lines or a comparison source, fit wavelength as a function of scan position, test that fit on unused lines, and establish which tracks share the same instrumental setting. Then assess photographic density, saturation, scattered light and scanner response before interpreting line ratios. The present CSVs preserve the measured scanner values for that next analysis.

03c /

Exposure-aware reassessment.

Repeated spectra, with five provisional Balmer-reference scales.

Five selected central-row profiles support the consecutive Hγ, Hδ, Hε, H8 and H9 interpretation. Other extracted tracks remain in scan-pixel coordinates. The apparent July 1950 date and written numeric settings do not establish a calibrated exposure or brightness sequence; those settings could be focus positions.
Across these scans, repeated photographic images need not imply the same mechanism. Shutter timing, guiding offsets, objective optics and different pointings can leave related patterns. Establish consistent component membership before fitting a smooth warp. No result here isolates glass deformation from telescope optics, emulsion, scanner geometry and centroid bias.

03d /

A provisional hydrogen wavelength ruler.

The selected spectra show five converging features consistent with consecutive Balmer lines: Hγ 4340.462 Å, Hδ 4101.740 Å, Hε 3970.072 Å, H8 3889.049 Å and H9 3835.384 Å (NIST air references). They span violet and near ultraviolet; telescope UV capability alone does not identify a plate’s bandpass.

We use Y = A + B(4000/λ)². Hγ and Hδ determine the two anchor parameters; the other three features are unused checks. Alternative consecutive Balmer assignments starting at upper levels n=3…8 were tested, and n=5 gives the best check residuals for all ten selected OP tracks. The supplied final scale refits all five features after those checks.

Five selected tracks on their Balmer-reference air-wavelength scales. Individual normalization is for pattern comparison, not line-flux measurement. Gray regions are outside the checked reference interval.
Unused-line checks and calibrated profiles
Track Unused-line RMS / native px Plot Data
S14 0.427 Open plot ↗ CSV ↓
S15 0.767 Open plot ↗ CSV ↓
S16 1.315 Open plot ↗ CSV ↓
S17 0.742 Open plot ↗ CSV ↓
S18 0.506 Open plot ↗ CSV ↓

Redshift is still a separate measurement.

A common Doppler shift is absorbed by the fitted coefficient B when stellar Balmer lines themselves define the wavelength ruler. These are Balmer-referenced rest-line coordinates, not independently calibrated observed wavelengths. No redshift or radial velocity is measured. A stationary comparison reference or an independently established instrumental dispersion scale is required to break that degeneracy.

The checked interval is 3835.384–4340.462 Å. Outside it, the model is extrapolation. Scanner response, saturation, photographic density, blending and line widths remain uncalibrated. Reported widths combine instrumental, stellar and photographic effects; they are not a pure resolving-power measurement. No calibration is assigned to the remaining raw tracks merely by proximity.

04 /

Distortion: what is measured, and what is not.

Five selected tracks support the consecutive Balmer assignment Hγ through H9. Hγ and Hδ anchor a two-parameter inverse-square dispersion model; the other three lines test it. Across both OP plates, unused-line RMS spans 0.25–1.32 native pixels. The delivered reference scale is then refitted to all five lines.

This is a provisional Balmer-referenced air-wavelength coordinate over 3835–4340 Å, not an independently determined observed-frame wavelength or flux scale. Fitting stellar lines to rest references absorbs a common Doppler shift into the dispersion coefficient: redshift and radial velocity remain unmeasured.

No distortion map is drawn for this plate. The absence of a fitted map records an evidence limit; it does not assert that the glass or optical system is undistorted.
05 /

Where the remaining questions live.

Review locations on the original scan

Select a numbered pin or a note. Locations are editorial review pointers, not measured confidence contours; plate-wide limitations also apply.

01Photographic streak grid

Streak strength and shape are measurable in pixels, but exposure ordering and units are unconfirmed.

02Caption versus bar boundary

Short written labels near streaks remain ambiguous where the signals touch. Inspect the layer overlay before deleting selected pixels.

03Margin metadata

The written schedule or instrument context is not yet transcribed with confidence.

The next useful experiment

Obtain an independent comparison-lamp or stationary reference, verify the spectral source and exposure schedule, then test observed wavelengths and photographic response.

Present conclusion

Five Balmer-referenced profiles per plate are supplied alongside the original pixel-coordinate extractions. Wavelength interpretation is provisional; flux calibration and redshift are unresolved.

06 /

An inspectable record for the next collaborator.

Source filename
OP966.tif
Native dimensions
6177 × 5026 pixels; I;16
Original SHA-256
b232f1eb7d507616f484e343e1c5c0e384a34f89ce3b4435a5ff66d8d9f18b5a
Display derivative
2600 × 2116 px; JPEG; no photometric calibration
Display stretch
Linear; percentile 1 = 0, percentile 99.7 = 54154.2; clipped to 8 bits
Detail crops
Fractional original-coordinate boxes recorded in source.json. Long margins are rotated and mirrored for reading.
Layer coordinates
Native original scan size, except explicitly labeled rectified UV1642 writing
Original TIFF
Not included in this portable report; retained separately, unchanged
Analysis method
Local Astrometry.net 0.98; inspected source selection, exposure grouping where necessary; saved reference associations and internal held-out checks
Snapshot date
27 October 2026

All scientific numbers are snapshots of the saved analysis products. The original 16-bit scans remain the measurement source. JPEG derivatives, contrast stretching and masked previews are inspection tools; do not derive photographic density or absolute response from their appearance.

  1. Astrometry.net: local plate-solving software
  2. Bundled methods, limitations and handoff notes
← IB5894OP967 →